Animal Social Network Visualization
ASNViz, a multimedia analytics solution that facilitates the visualization and analysis of animal social networks (ASNs).
We present ASNViz, a multimedia analytics solution that facilitates the visualization and analysis of animal social networks (ASNs). By modeling ASNs as networks of nodes and edges, ASNViz provides valuable insights into the dynamics and evolution of animal communities. The tool quantifies and visualizes the social structure at node and network levels, predicts future interactions when new individuals are added using deep-learning, and allows for manual updates based on empirical observations. The predictions of future interactions are made using Variational Graph Auto-Encoder models, which can be retrained and stored by the user while updating the network. A separate view gives insights to the evolution of networks based on the nodes and interactions observed and predicted between versions. ASNViz aims to bridge the gap between biology and complex network sciences, providing accessible network visualizations, interactions, and analytics for researchers interested in studying ASNs.
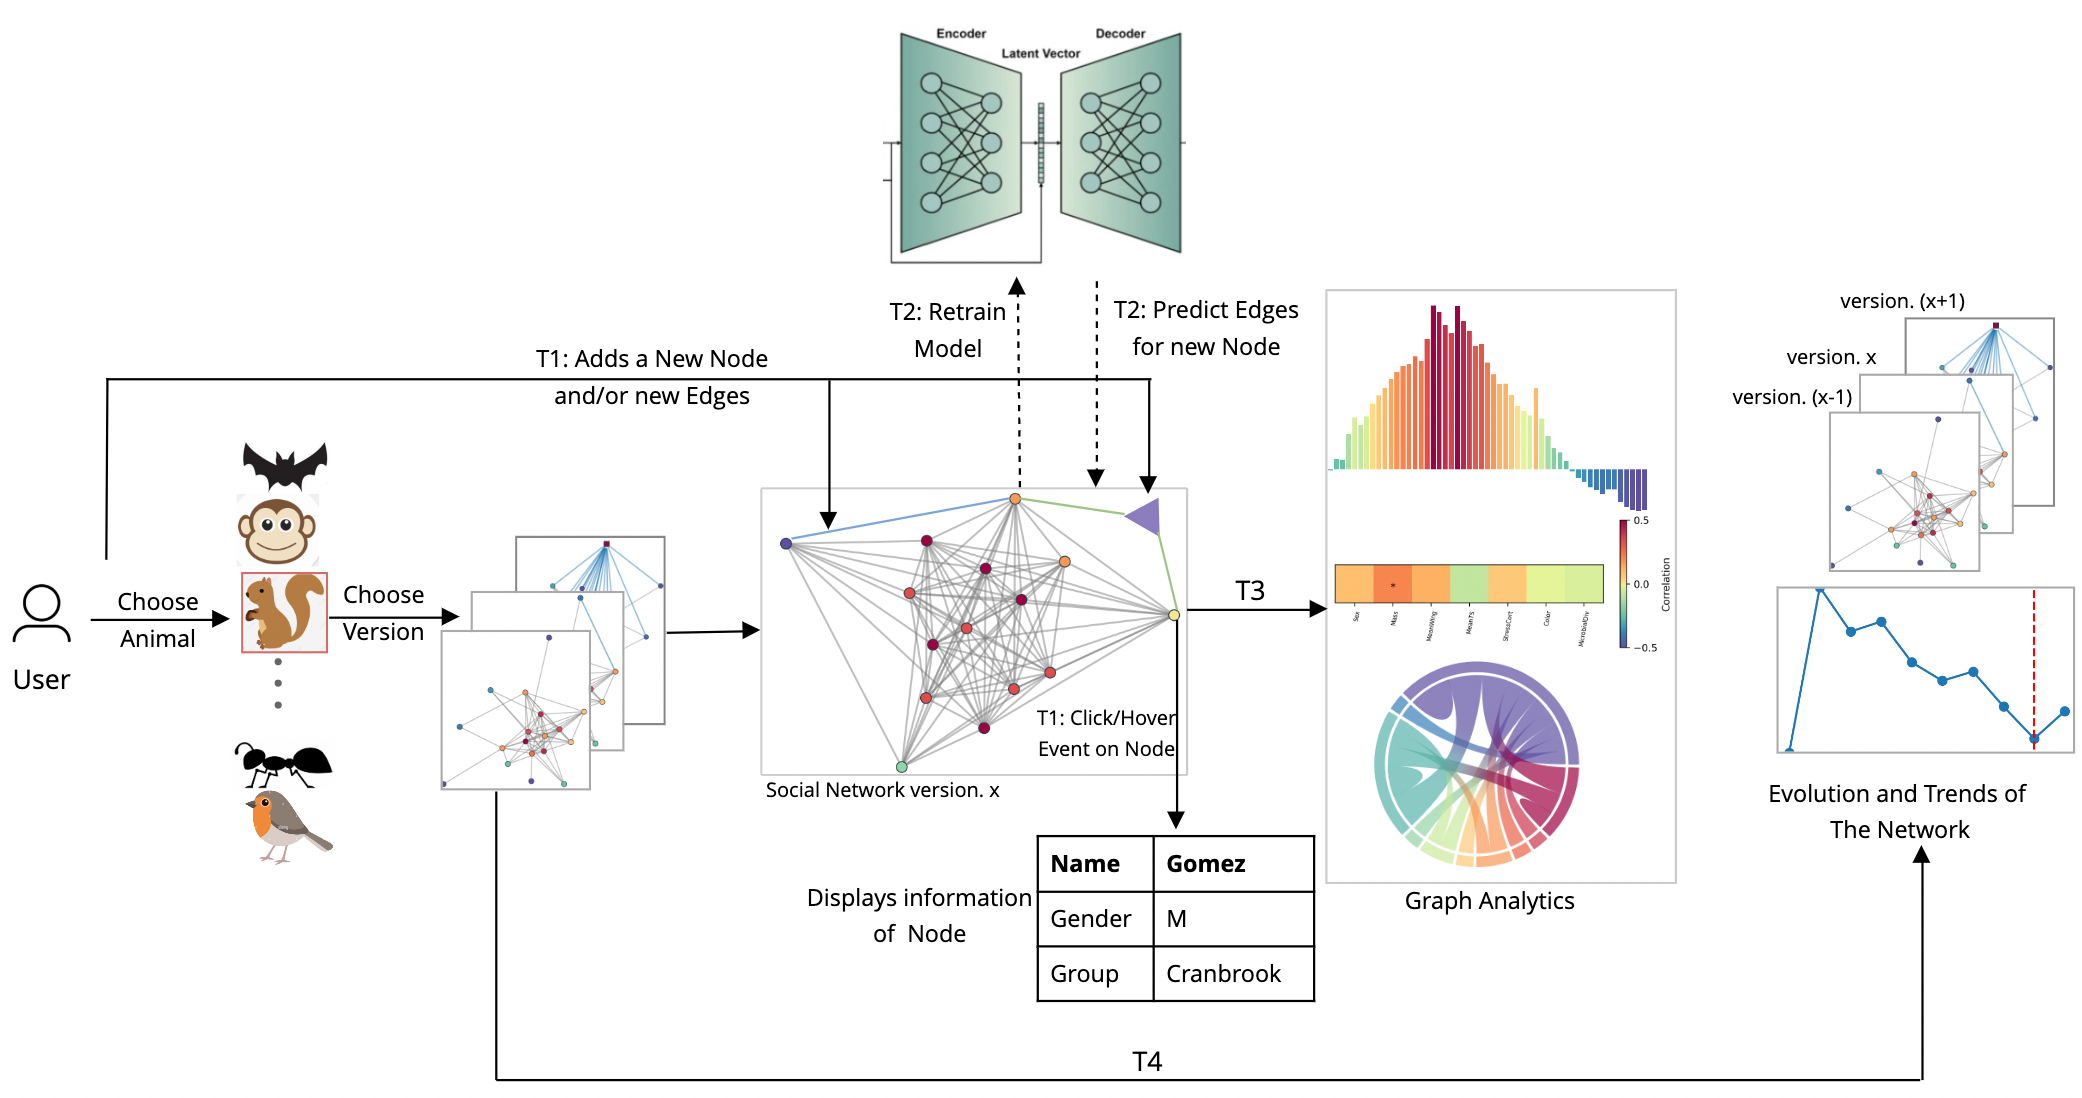
The following are the main user and system tasks:
- Task 1 (T1) User interacts with social network: The user wants to interact with the animal nodes of the social network to know their particular features. The user should be able to manually add nodes and edges to the network.
- Task 2 (T2) System provides feedback to user interactions: The system should be able to actively monitor user actions, and provide feedback in the form of real-time updates to the network.
- Task 3 (T3) Analyze the social network: The user should be presented with insightful visualizations summarising information of various aspects - nodes, interactions, and the full network structure. These analytics should adapt to possible changes to the network.
- Task 4 (T4) Visualizing the iterative evolution of network: The user should be able to see a timeline of how the network has changed from the base snapshot to any updated snapshot.
- Task 5 (T5) System is adaptable to other networks: The system should be dynamic, and should be able to adapt to any other animal social network.

For an in-depth understanding of ASNViz, find our paper here.
Also find the code of the project here.